
 Version for the visually impaired
Business Environment Index, August 2026
The RSPP Environment Index records a modest recovery, with the Composite Index rising by 0.9 points to 43.3 points, breaking a three-month streak of consecutive declines. Nevertheless, the index remains significantly below the 50-point threshold, indicating a persistent predominance of negative assessments of business conditions.
Product Market and Pricing Trends
The Product Market Index edges down by a further 0.4 points to 43.6 points, following a sharp 2.5-point drop in July. Procurement price assessments improve slightly, with the indicator gaining 1.7 points to 24.7 points, as the share of companies reporting rising procurement costs declines marginally from 52.3% to 51.7%. Selling prices continue their downward trend, losing 0.9 points to 52.0 points, though the indicator remains in positive territory as price increases still outnumber price decreases.
Demand dynamics present a mixed picture. Sectoral demand, which had risen by 2.3 points in July, fell sharply by 4.6 points to 40.7 points, with 25.6% of companies reporting a decline. In contrast, demand for companies' own products or services improves by 1.4 points to 44.1 points, recovering some of the previous month's losses; the share of negative assessments in this category falls by 8.9 percentage points to 21.3%, though the share reporting growth also declines by 4 percentage points. The competition indicator stabilizes, rising by 0.4 points to 56.6 points after a sharp drop in July.
B2B Index
The B2B Index remains virtually unchanged at 45.8 points, down just 0.1 points from July. The new orders indicator returns to positive territory, gaining 2.6 points to reach 51.4 points, recovering the ground lost in July when it fell below 50 points for the first time since April 2026. Order fulfillment timelines continue to worsen, with the indicator edging down by 0.5 points to 46.3 points following a steep 5.2-point decline in July. Outstanding obligations to counterparties lose 0.5 points to 47.2 points, while obligations from counterparties fall more substantially by 1.9 points to 38.2 points, as the share of companies reporting an increase in overdue obligations from counterparties rises by 2 percentage points.
Logistics Index
The Logistics Index continues its negative trajectory, declining for the fourth consecutive month from 50.4 points in April to 41.9 points in August, with a monthly drop of 2.1 points. The deterioration is likely linked to persistent fuel shortages, which are constraining supply, increasing transport costs, and complicating delivery schedules. The overall logistics conditions indicator falls by 3.3 points to 37.4 points, with the share of companies reporting worsening conditions rising from one-fifth in July to 29.2% in August. The inventory levels indicator leaves positive territory for the first time since December 2025, dropping by 2 points to 48.9 points, while average delivery times lose 1.1 points to 39.3 points.
B2G Index
The B2G Index returns to decline, falling by 1.2 points to 47.4 points after a 1.9-point rise in July. Relations with banks and financial institutions drop by 2.7 points to 45.8 points, reverting to June levels after July's improvement, as the share of negative assessments nearly doubles from 6.9% to 12.4%. Relations with government authorities also deteriorated, with the indicator falling by 1.1 points to 48.6 points, the lowest level recorded in the past year of observations. Relations with foreign partners hold steady at 47.8 points.
Financial Markets Index
The Financial Markets Index rises by 0.7 points to 41.4 points, following July's one-and-a-half-year low. The financial position of companies improves by 1.4 points to 40.4 points, as the share of respondents reporting a substantial deterioration in their financial position falls by 5 percentage points, despite the overall distribution of positive, neutral, and negative assessments remaining largely unchanged. The stock market indicator edges up by 0.9 points to 41.0 points, while currency market assessments dip slightly by 0.3 points.
Personal Assessments Index
The Personal Assessments Index records the largest raise among all RSPP business climate indices, rising by 8.5 points to 39.6 points, recovering most of the ground lost in July when the index fell to a year-low of 31.1 points. The share of respondents reporting a deterioration in the business climate falls sharply from 38.4% to 24.7%, as companies shift significantly toward neutral assessments.
Social and Investment Activity
Investment activity continues to contract, with 64% of surveyed enterprises reporting investment projects in August, a further decline of 6.9 percentage points following a 6.1-point drop in July. Among these, 71% are proceeding without changes to schedules or budgets, while 22.6% report delays and 14.5% have been forced to reduce investment budgets. Only 3.2% of companies are operating ahead of schedule, and 8.1% report increased investment volumes.
Hiring activity falls to 69.7% of organizations, a decline of 10.5 percentage points, while layoffs are reported by 9% of companies. Measures to reduce working hours are implemented by 14.6% of firms, largely unchanged from the previous month.
Social programs for employees remain in place at 84.3% of participating firms, with programs supporting other categories of citizens present at 49.4% of companies. The most common employee social programs include vouchers for health and children's recreation (69.7%), additional payments beyond the Labor Code (63.2%), transport provision (63.2%), and meal provision (57.9%). Budgets for employee social programs remain unchanged at 77.9% of companies, while 15.6% report an increase and 6.5% report a reduction.
Approximately 64% of organizations continue to participate in measures to reduce labor market tensions. Advanced training for employees is provided by 41.6% of companies, internships are offered by 37.1%, and one-third of surveyed firms operate temporary employment programs for the population.
The RSPP's Q2 2026 monitoring reveals that non-payments by counterparties have re-emerged as the primary constraint on business activity, cited by nearly 40% of companies (+5.6 p.p.), while reduced demand falls to second place at one-third of respondents. A shortage of working capital affects 26.9% of organizations (+4.6 p.p.). Supply disruptions for raw materials and components rise sharply by 12.5 percentage points to 23.1%, likely reflecting refinery outages and fuel shortages. Access to borrowed funds improves, with the share citing this constraint falling by 8.1 percentage points to approximately 15%. Production volume reductions and investment program cuts both increase, while sanctions pressure eases notably, with the share citing this factor halving from 16.5% to 9%.
In response to current conditions, an overwhelming 86.3% of companies plan to reduce costs, up sharply from 65.4% in Q1. The share planning price increases more than doubles to 26%, while digital technology implementation gains 10 percentage points to 27.4%. Among cost-cutting firms, 83.6% target administrative expenses, and nearly half (46.3%) plan personnel cost reductions—almost double the previous quarter's figure. Hiring freezes emerge as the primary tool for personnel optimization, cited by 71.9% of this group, while 28.1% consider workforce reductions and 20% plan wage or benefit cuts. Approximately one-quarter of companies intend to switch to cheaper raw materials, while another quarter plan to reduce social and charitable budgets.
The July 2026 survey round conducted by the Russian Union of Industrialists and Entrepreneurs (RSPP) reveals a sustained negative trend across most indicators over the past three months. The Composite Business Climate Index falls by a further 1.4 points to 42.4 points, marking a continued deterioration in business sentiment.
Product Market and Pricing Trends
The Product Market Index declines sharply by 2.5 points to 44.0 points. Procurement price pressures intensify, with 52.3% of respondents reporting an increase in procurement costs, up from 45% in the previous month. As a result, the procurement price indicator loses 6.8 points. Demand dynamics present a mixed picture: sectoral demand improves by 2.3 points to 45.3 points, while demand for companies’ own products or services declines by 2.1 points to 42.7 points. The share of companies reporting lower demand reaches 24.4% for sectoral demand and 30.2% for company-specific demand. The competition indicator falls by 4.7 points to 56.1 points, as the share of companies reporting increased competition drops from 23% in June to just 10.5% in July, with most assessments shifting to the neutral category.
B2B Index
The B2B Index declines to 45.9 points from 47.9 points in June. The new orders indicator exits positive territory, where it had remained from April through June, falling by 3 points to 48.8 points. Positive assessments no longer outweigh negative ones, reversing the trend observed in previous months. Order fulfillment timelines worsen considerably, with the corresponding indicator dropping by 5.2 points to 46.8 points. The share of companies able to reduce production lead times plummets from 9% to just 1.7%, suggesting that resources for accelerating production have been exhausted. The indicator for outstanding obligations to counterparties edges down by 0.6 points to 47.7 points.
Logistics Index
The Logistics Index experiences a substantial decline, falling by 3.8 points to 44.0 points. This negative trend is likely attributable to unplanned capacity outages at several of the country’s largest oil refineries, which have created fuel shortages and disrupted logistics chains. Both the overall logistics conditions indicator and the average delivery time indicator lose 4.4 points each, settling at 40.7 points and 40.4 points, respectively. While the inventory levels component remains in positive territory, it too declines from 53.8 points to 50.9 points.
B2G Index
The B2G Index rises by 1.9 points to 48.6 points, recovering some ground after recent declines. Relations with banks and financial institutions, which had reached a one-and-a-half-year low of 45.0 points in June, rebound to 48.5 points, matching the May reading. The share of negative assessments in this category halves from 14% to 7%, with more companies opting for the neutral response. Relations with government authorities remain unchanged at 49.7 points, while relations with foreign partners improve by 2.4 points to 47.7 points, as the share of negative assessments falls by 7.2 percentage points in favor of neutral responses; 91.9% of respondents report no change in this area.
Financial Markets Index
The Financial Markets Index remains virtually flat at 40.7 points, down just 0.1 points from June, though this represents the lowest level recorded in the past one and a half years of the survey. The financial position of companies worsens slightly, with the indicator falling by 0.8 points to 39.0 points as the balance of assessments shifts modestly toward the negative side. The stock market indicator drops by 2.4 points to 40.1 points, and notably, no respondent reports a positive assessment of stock market dynamics in July, compared with a 3% share of positive responses in June. In contrast, the currency market indicator improves by 2.7 points to 43.0 points, as the share of negative assessments declines by 5 percentage points in favor of neutral responses.
Personal Assessments Index
The Personal Assessments Index falls by a further 2.7 points to 31.1 points. The share of respondents reporting a deterioration in the business climate over the month rises by 3.4 percentage points to 38.4%, underscoring deepening pessimism among business leaders.
Social and Investment Activity
Investment activity is reported by 70.9% of surveyed organizations, a decline of 6.1 percentage points from the previous month. Among these, 63.9% are proceeding without changes to schedules or budgets, while 29.5% report delays, and 21.3% have been forced to reduce their investment budgets. Only approximately 5% of companies succeed in increasing investment volumes, and just 1.6% are operating ahead of schedule, with the distribution remaining largely unchanged from June.
Hiring activity is reported by 80.2% of organizations, while 15.1% have had to lay off employees. Measures to reduce working hours are implemented by 14.8% of companies, with changes in these shares falling within the margin of statistical error.
Social programs for employees remain in place at 86.0% of participating firms, while programs supporting other categories of citizens are present at 48.9% of companies. The most common employee social programs include vouchers for health and children’s recreation (72.6%), additional payments beyond the Labor Code (63.0%), voluntary health insurance (60.3%), and meal provision (53.4%). Budgets for employee social programs remain unchanged at nearly three-quarters of companies, while 16.7% report an increase and 9.7% report a reduction.
Approximately 70% of organizations continue to participate in implementing additional measures to reduce labor market tensions, consistent with the previous month. Advanced training for employees is provided by 45.3% of companies, internships are offered by 41.9%, and one-third of surveyed firms operate temporary employment programs for the population.
The latest RSPP survey shows that the composite Business Environment Index fell further in June, declining by 1.3 points to 43.8 points. The drop was driven by weaker financial indicators and a sharp fall in the personal assessment index, alongside continued declines in the B2G and logistics components. On a more positive note, the manufactured products index and the B2B index both moved upward.
The manufactured products index rose by 1.3 points to 46.5 points. One in ten companies reported lower procurement prices, up from the previous month, lifting that sub-index to 29.8 points. The selling prices index, however, eased by 1.7 points to 54 points.
Demand indicators improved, with both the industry demand index and the index for demand for companies' own products rising by 2.6 points each to 43 points and 44.8 points, respectively. The improvement came mainly from fewer negative responses, as more companies chose neutral answers.
The B2B index edged up 0.5 points to 47.4 points. New orders remained in positive territory for the third month running, reaching 51.8 points. Order fulfillment times moved above the 50-point mark to 52 points, as 9% of companies shortened lead times while only 7% reported delays. Most companies – 84% – saw no change.
The indicator for overdue obligations improved by 1.6 points to 48.3 points. While 10% of companies reduced their outstanding obligations, 14% saw an increase, and 76% reported no change. However, the counterparty payment discipline index fell by 2.5 points to 37.5 points, signaling ongoing difficulties with supplier payments.
The logistics index continued to decline, losing 0.4 points to reach 47.8 points. While 85% of companies rated the logistics situation as neutral, 12% reported deterioration and only 3% saw improvement. Delivery times worsened significantly, with the corresponding indicator dropping 3.5 points to 44.8 points.
The B2G index fell further to 46.7 points. Relations with banks and financial institutions saw the steepest decline, falling 3.3 points to 45 points – the lowest level in a year and a half. Although 81% of companies reported no change, the share citing deterioration nearly tripled to 14%. Indicators for relations with government authorities and foreign partners remained unchanged at 49.8 points and 45.3 points, respectively.
The financial markets index dropped to 40.8 points, its lowest level in 18 months, declining 2.6 points from May. While 70% of companies reported no change in their financial position, 24% saw deterioration and only 6% improved, compared to nearly 11% a month earlier. The currency market indicator fell 3.7 points to 40.3 points, as the share of companies reporting worsening currency conditions rose from 12% to 19%. Stock market assessments also weakened, falling 3.8 points to 42.5 points.
The personal assessment index, which had been rising for two months, reversed sharply in June, dropping 5.2 points. The share of respondents giving negative personal evaluations rose from 27% to 35%, indicating growing concern among business leaders about the overall economic climate.
Investment and Social Activity Index
In June, 77% of surveyed companies reported running investment programs, up from two-thirds in May. Among these, two-thirds kept their projects on track and within budget. Just over a quarter (26.3%) fell behind schedule, while a similar share (23.7%) reduced their investment budgets. Only 3.9% of companies managed to move ahead of schedule and increase spending – down from 10% in May.
Hiring activity rebounded to 71%, returning to typical levels after a dip in May. Layoffs fell sharply to 13%, down 7 percentage points from the previous month. One-fifth of companies continued to reduce working hours to cut costs, with that share remaining largely unchanged.
Social programs for employees remained widespread, operating at 89% of companies, while programs supporting other groups were in place at 60% of firms. The most common employee benefits were paid vouchers for sanatorium treatment and children's holidays (70.5%), extra payments beyond legal requirements (63.6%), voluntary health insurance (63.6%), transport assistance (62.5%), meal subsidies (60.2%), housing programs (43.2%), and supplemental pension insurance (18.2%). Additional initiatives cited by some companies included support for young staff, corporate sports and cultural events, accident insurance, gym memberships, family support programs, gifts for employees' children, assistance for veterans and retirees, vocational training, and extra vacation days.
Two-thirds of companies kept their social program budgets unchanged, while 20.2% increased spending and 13.5% cut it – a notable rise from 6.3% in May. Additional measures to ease labor market pressures were implemented by 70% of respondents, including advanced training (53%), internships (46%), and temporary employment programs (25%).
Russian Business Climate Index Drops in May as Demand Weakens and Logistics Pressures Mount
According to the latest monthly survey by the Russian Union of Industrialists and Entrepreneurs (RSPP), the composite Business Environment Index fell by 1.1 points in May 2026 to 45.1 points. The decline was driven primarily by worsening conditions in the financial sector, business-to-government (B2G) interactions, and logistics, while other components showed mixed performance.
The index for manufactured products remained virtually unchanged at 45.2 points. However, respondents expressed a more negative view of procurement prices: that sub-index fell sharply by 5.6 points to 27 points, with only 6.7% of companies reporting lower purchase prices compared to 11.2% in April. In contrast, the selling prices index rose to 55.7 points from 48.3 points, as a quarter of companies reported raising prices in May, up from just 13.5% the previous month.
Demand conditions continued to deteriorate. The industry demand indicator fell to 40.3 points, and the indicator for demand for a company’s own products or services dropped to 42 points. Over 30% of companies reported an overall contraction in market demand. At the same time, the competition index rose slightly to 61 points, indicating persistent high competitive pressure.
The B2B index inched up by 0.4 points to 46.9 points. The sub-index for new orders remained in positive territory at 51 points, though down from 54.5 points a month earlier. Order fulfillment timelines hit a borderline 50 points, with 89.3% of companies reporting no change. The share of negative assessments of overdue obligations from counterparties improved, pushing that indicator up by 1.2 points to 46.7 points. However, the index for counterparty payment discipline remained weak at 40 points, albeit up 1.8 points from April.
Logistics failed to stay in positive territory, with the logistics index falling 2.5 points to 48.2 points. While 88% of companies rated the overall logistics situation as neutral, the remaining respondents leaned negative, pulling the sub-index down to 45 points. Average delivery times edged down slightly, while the inventory level index dropped 4.3 points to 51.3 points, as the share of companies reporting higher inventories fell from one-fifth to 14.6%.
The B2G index returned to negative territory, losing 2.7 points to reach 47.8 points. Over 90% of respondents said their B2G relationships had not changed in character, but negative assessments prevailed across all indicators. Relations with banks and financial institutions fell to 48.3 points, relations with government authorities dropped to 49.7 points, and the indicator for relations with foreign partners plunged 4.7 points to 45.3 points. The share of negative responses in the latter category rose from 1.1% to 6.7%.
The financial markets index reversed its April gain, falling 3.2 points to 43.4 points. The share of companies reporting a worsening financial position rose to 29.3% from 21.3% in April, pushing that sub-index down 3.3 points to 40 points. The currency market indicator, which had reached a one-year high in April, dropped 4.9 points, with 12% of companies reporting a deterioration compared to just 4.5% a month earlier. Stock market assessments also worsened moderately.
In a partial bright spot, the personal assessment index continued to rise, adding 1.1 points to reach 39 points, as the share of respondents giving negative personal evaluations fell from 30.3% to 26.7%.
Investment and Social Activity Remain Stable but Hiring Slows
On the investment front, two-thirds of surveyed companies continued to carry out investment programs in May, unchanged from previous periods. Among those, 62% kept projects on budget and schedule, while 26% fell behind schedule and 18% reduced their investment budgets. Only 6% moved ahead of schedule, and 10% managed to increase investment spending.
Hiring activity dropped significantly, with only 68% of companies recruiting new staff, down 10.7 percentage points. At the same time, 20% of organizations laid off workers, and 20.3% implemented working-hour reductions to cut costs — both figures representing an increase from previous months.
Social programs for employees remained widespread, operating at 84% of companies, while programs supporting other categories of citizens were in place at 57.3% of firms. Among employee-focused social benefits, the most common were voluntary health insurance (73%), paid vouchers for sanatorium treatment and children’s holidays (68.3%), additional payments not required by labor law (66.7%), meal subsidies (63.5%), transport or commute assistance (57.1%), housing programs including mortgages (44.4%), and supplemental pension insurance (20.6%). Additional voluntary measures reported by some companies included support for young employees, corporate sports and cultural events, accident insurance, gym memberships, support for motherhood and large families, gifts for employees’ children, assistance for veterans and retirees, vocational training, and extra vacation days.
Two-thirds of companies maintaining social programs kept their budgets unchanged, while 27% increased spending and 6.3% cut back. Additional measures to reduce labor market tensions were implemented by 66.7% of firms, including internships (44%), advanced training for employees (40%), and temporary employment programs (22.7%).
The Russian Union of Industrialists and Entrepreneurs (RSPP) has released its quarterly monitoring results for the first quarter of 2026. The findings reveal a notable shift in the perceived constraints on corporate activity and the strategic measures companies are planning to adopt in response to prevailing economic conditions.
Declining Demand Emerges as the Primary Constraint
For the first time in recent quarters, declining demand for goods and services has become the most frequently cited obstacle to business operations. Some 37.6 percent of respondents identified weak demand as a key constraint, representing an increase of 4.5 percentage points from the fourth quarter of 2025. This marks a significant shift in sentiment, suggesting that demand-side pressures are now eclipsing other operational challenges.
Payment Delinquencies Ease, Financial Constraints Remain Acute
The issue of non-payments by counterparties, which had been the dominant concern in the previous quarter with 42.3 percent of mentions, receded somewhat in Q1 2026. Its share fell by 8.1 percentage points to 34.1 percent. However, financial constraints remain highly prominent. Approximately one-quarter of surveyed companies cited limited access to borrowed financial resources and insufficient working capital as major impediments. Notably, compared to the previous quarter, the significance of access to finance has increased, while the urgency of working capital shortages has moderated slightly.
Sanctions and Fiscal Pressures Register as Secondary Concerns
Western sanctions were cited as a negative factor by 16.5 percent of respondents, while 14.1 percent reported that increased fiscal burdens, including both tax and non-tax payments, had adversely affected their operations. Just over one-tenth of companies (11.8 percent) pointed to the inability to acquire new equipment and technologies due to import restrictions, and an identical share cited sharp increases in domestic product prices.
Logistics, Currency, and Debt Constraints Affect a Smaller Cohort
Logistics-related issues—including delivery disruptions for raw materials and components, deteriorating transport conditions, and worsening supply terms—constrained activity for 10.6 percent of participating organizations. Currency instability was cited by an equal proportion. Slightly fewer respondents (just below 10 percent) reported that rising debt burdens from loans and bond issuances were hampering operations, while 9.4 percent noted a reduction in production volumes.
Investment and Cross-Border Payment Constraints Are Less Widespread
Two distinct constraints were each cited by 7.2 percent of companies: the reduction or postponement of investment programmes and the inability to conduct payments with foreign counterparties. Compared to Q4 2025, fewer respondents indicated that they had been forced to scale back their investment projects, suggesting a modest stabilization in this area.
Only a Small Minority Face Severe Partnership or Administrative Disruptions
Fewer than 4 percent of surveyed companies identified the following as significant constraints: partner withdrawals from joint projects, rising prices for foreign goods, contract repricing, bank payment delays, and increased administrative burdens. Approximately one-tenth of enterprises reported encountering no problems that negatively affected their financial performance or economic position.
Corporate Response Strategies Shift Toward Cost Containment
When asked about planned measures to improve efficiency under current conditions, an overwhelming majority of companies—65.4 percent—stated that they intend to reduce expenses. This represents a notable decline from the fourth quarter of 2025, when 82.5 percent of respondents indicated similar plans, suggesting that aggressive cost-cutting may have already been implemented in prior periods.
Energy Efficiency and Digitalization Gain Traction
Energy and resource conservation programmes are being planned by 28.4 percent of organizations, an increase of 6.5 percentage points from the previous quarter. Digital technology implementation projects are on the agenda for 16 percent of enterprises, though this marks a decline from 27 percent in Q4 2025, when digitalization was the second most popular strategic priority.
Investment, Pricing, and Production Adjustments Are Less Common
Some 14.8 percent of companies intend to maintain or increase investment volumes. A further 12.3 percent plan to restructure their cost base without reducing overall expenditure or output. An equal share of respondents indicated they would intensify production, demand advance payments from customers, or cease advance payments to suppliers. Price increases are being considered by 11.1 percent of companies, while the same proportion plans to scale back investment programmes.
Import Substitution and Asset Sales Remain Niche Responses
Import substitution programmes are being developed by 8.6 percent of participating organizations. Fewer than 5 percent of respondents reported plans to reduce production volumes, sell non-core or even core assets, revise supplier lists due to import restrictions, or seek new export destinations in response to Western sanctions.
Where Costs Will Be Cut: Administration, Services, and Now Labour
Among companies planning expense reductions, administrative and general overhead costs remain the primary target, cited by more than 80 percent. Reductions in spending on purchased services, including consulting, also remain popular. However, a sharp reassessment has occurred regarding raw material and component savings: the share of companies planning cuts in this area fell from 30.1 percent in Q4 2025 to just 13.9 percent in Q1 2026.
Conversely, the popularity of personnel-related cost reductions has increased significantly, rising from 12.4 percent to 25 percent. Social and charitable programme spending remains a target for 23.6 percent of organizations, virtually unchanged from the previous quarter.
Personnel Reduction Strategies Focus on Hiring Freezes and Layoffs
Among companies planning to cut personnel costs, the most common measure is a reduction in new hiring. Approximately half of these organizations also indicated they would consider dismissing employees, shifting staff to part-time arrangements, or placing workers on unpaid leave. One respondent added a custom response: plans include reducing overtime, optimizing headcount allocation, replacing outsourced staff with newly available permanent employees, and, if necessary, providing retraining at the company's expense.
The RSPP's Q1 2026 monitoring reveals a business environment increasingly constrained by weakening demand, while financial pressures—though still acute—have shown some signs of stabilization. Companies are pivoting away from broad-based cost cuts toward more targeted measures, with a renewed focus on labour cost reduction and operational efficiency. The decline in planned digitalization investments and the modest uptick in energy efficiency programmes suggest a recalibration of priorities toward immediate, tangible savings.
The Russian Union of Industrialists and Entrepreneurs (RSPP) released its latest business environment survey for April 2026, reporting a 2.4-point increase in the Composite Business Climate Index to 46.2. Most component indices recorded gains, with the Logistics and B2G indices moving into positive territory. The product markets index was the sole exception, declining modestly.
Divergent Pricing Trends
Procurement price dynamics intensified significantly, with the corresponding index rising 7.3 points to 32.6, its highest level in six years. Conversely, the sales price index declined by 7 points to 48.3. The proportion of respondents reporting higher purchase prices fell from 54.2 percent to 44 percent, accompanied by a shift toward "prices unchanged." Concurrently, the share of companies that raised their own selling prices contracted from 23.4 percent to 13.5 percent.
Demand Conditions Remain Weak
Industry-wide demand continued to contract, with 29.2 percent of companies reporting a decline. Only 14.6 percent registered growth, while 56.2 percent observed no change. The demand index for the industry fell 0.5 points to 41. Own-product demand improved marginally by 0.7 points to 43, though a majority of respondents again reported stable conditions.
New Orders Return to Growth
The new orders index rebounded into positive territory at 54.5 points. The share of companies reporting a reduction in new orders nearly halved, declining from 22.3 percent to 12.4 percent. Order fulfillment timelines remained largely unchanged for 86.5 percent of respondents, with the corresponding index edging up 0.5 points to 47.8.
Competitive Pressure Moderates
The competition index fell by 4.8 points to 60.1, driven by a greater number of respondents indicating no change in competitive intensity.
The indicator for companies' own fulfilment of contractual obligations rose 1.6 points to 45.5, supported by a 3-percentage-point reduction in negative assessments. Counterparty performance also improved, with the share of firms noting an increase in unmet obligations falling by approximately 3 percentage points. The corresponding index advanced 2.3 points to 38.2.
Logistics Sector Turns Positive
The logistics index rose to 50.7, entering positive assessment territory. Nearly 90 percent of companies gave a neutral evaluation of overall logistics conditions, while negative assessments declined from 11.7 percent to 7.9 percent. Delivery times stabilized: the share of companies reporting longer delivery windows fell from 8.5 percent to 5.6 percent, lifting the relevant indicator 1.8 points to 48.9. The warehouse inventory index remained firmly positive, increasing 2.4 points to 55.6.
B2G and External Relations Improve
The B2G index rose to 50.5, up from 48.9 in March. Relations with government bodies held steady at 50.6 points. The indicator for relations with banks and financial institutions returned to positive territory at 50.8 points, with 5.6 percent of respondents reporting improvement against 3.4 percent citing deterioration. The index for relations with foreign partners reached the neutral 50-point threshold, as 97.7 percent of respondents reported no change.
Financial Indicators Strengthen
The financial markets index gained 4 points to 46.8. The share of companies reporting a deterioration in financial position fell from 31.9 percent to 21.3 percent, raising the corresponding indicator 3.7 points to 43.3. The currency market index reached a one-year high of 48.9 points, a gain of 4 points, as negative assessments dropped from 10.6 percent to 4.5 percent. The stock market index advanced 4.4 points to 48.3. Personal assessments of the business climate rebounded 5.7 points to 37.9, following a sharp decline in the prior period.
Investment Activity: Stabilization with Continued Caution
Two-thirds of surveyed enterprises reported active investment programmes. Among these, 70 percent adhered to original budgets and schedules, recovering from a decline to 53.2 percent in March. However, 22.2 percent reported delays, and an equal proportion were forced to reduce investment budgets. Only 1.6 percent achieved accelerated timelines, and 4.8 percent increased investment spending.
Labor Market and Social Programmes Remain Resilient
Hiring activity was reported by 78.7 percent of companies, while 9 percent implemented staff reductions. Cost-cutting measures involving reduced working hours were adopted by 13.5 percent of firms.
Social programmes for employees remained widespread, present at 83.1 percent of companies. The most frequently cited benefits included health and children's holiday vouchers (82.4 percent), voluntary medical insurance (68.9 percent), supplementary payments beyond statutory requirements (68.9 percent), transport provisions (60.8 percent), meal subsidies (54.1 percent), housing programmes including mortgages (43.2 percent), and supplementary pension insurance (20.3 percent). Budgets for social programmes remained unchanged at 75 percent of companies, increased at one-fifth, and decreased at 5.6 percent.
Seventy-five percent of surveyed enterprises implemented additional measures to reduce labour market tensions. Forty-seven percent supported internships, and an equal proportion invested in advanced training. Temporary employment programmes were organized by 20 percent of companies.
The April 2026 survey indicates a modest improvement in Russian business conditions, driven by a rebound in new orders, a return to positive territory for the logistics and B2G indices, and stabilization in financial and external indicators. However, persistently weak demand, continued cost pressures, and a cautious stance on investment underscore that the recovery remains incomplete.
According to the latest survey conducted by the Russian Union of Industrialists and Entrepreneurs (RSPP) in March 2026, the Business Climate Index falls by 1.7 points to 43.8 points, marking a 12-month low. The negative trend is primarily driven by deteriorating personal assessments of the business climate, alongside declines in the B2B, B2G, and Financial Markets indices.
Product Market and Pricing Trends
The Product Market Index stands at 45.9 points, gaining 0.6 points from February. The procurement price indicator rises by 7.1 points to 25.3 points, as the share of companies reporting rising procurement costs declines from two-thirds to 54.2%, with more respondents opting for “prices unchanged.” In contrast, the selling prices indicator drops by 4.8 points to 55.3 points, reflecting a reduction in the share of companies raising prices from 31.6% to 23.4%.
Demand and Competition
Sectoral demand remains nearly unchanged at 41.5 points, down just 0.3 points, while demand for companies’ own products or services falls by 1.9 points to 42.3 points. Nearly one-third of respondents report a decline in demand, compared to 27.4% in February. Competitive pressure intensifies, with 29.7% of companies reporting increased competition. The competition indicator rises by 2.5 points to 64.9 points.
Orders and Contractual Obligations The B2B index declines by 1.2 points to 43.9 points. The new orders indicator turns negative for the first time in four months, dropping to 48.3 points. Order fulfillment timelines improve slightly, with the indicator gaining 2.3 points to 47.3 points, though negative assessments still prevail. The gap between companies reporting longer versus shorter fulfillment times narrows to 4.2%, compared to 9.4% in February.
Obligations toward counterparties and from counterparties both worsen. The former falls by 1.4 points to 43.9 points, while the latter drops by 2 points to 35.9 points. The share of companies reporting an increase in overdue obligations to counterparties stands at 14.8%, and 31.9% report a rise in obligations owed to them.
Logistics and Inventory
The Logistics Index approaches the threshold, rising to 49.0 points. Negative assessments of logistics conditions fall by 5 percentage points to 11.7%, as more companies report no change, pushing the logistics conditions indicator up by 2.9 points to 46.8 points. Average delivery times also improve, with the corresponding indicator gaining 4.7 points. Inventory levels remain in positive territory but decline by 3.4 points to 53.2 points.
Government and Financial Relations
The B2G (Business-Government) Index returns to negative territory, falling from 51.8 points to 48.9 points. The business-government relations indicator drops sharply by 6.8 points to 50.8 points, as the share of negative assessments rises from 1.5% to 6.4%. In contrast, relations with banks and financial institutions improve by 1.3 points to 49.7 points. Relations with foreign partners deteriorate, with the indicator falling 2.9 points as negative assessments increase.
Financial Markets and Corporate Health
The Financial Markets Index declines by 2.5 points to 42.8 points. The financial position of companies falls by 3.8 points to 43.4 points, with 31.9% of respondents reporting deterioration, up from 27.4% in February. The stock market indicator drops 3.6 points to 43.9 points, as the share of negative assessments rises from 10% to 14.9%. The currency market indicator holds steady at 44.9 points.
Personal Business Climate Assessments
Negative personal assessments of the business climate rise sharply, with 43.6% of respondents reporting worsening conditions, compared to 33.6% in February. The Personal Assessments Index falls by 6 points to 32.2 points, its lowest level since December 2025.
Social and Investment Activity
Approximately 60% of surveyed enterprises are implementing investment programs in March. Among them, only half are proceeding without changes to schedules or budgets, while the share reporting delays rises significantly by 13 percentage points to 30.6%. One-quarter of companies reduce investment funding, while only 8.1% manage to increase it.
Hiring activity is reported by 81.9% of organizations. Layoffs are implemented by 5.3% of companies, and 11.7% take measures to reduce working hours.
Social programs for employees remain in place at 85.1% of firms, with programs supporting other categories of citizens present at 58.5% of companies. The most common employee social programs include vouchers for health and children’s recreation (71.6%), voluntary health insurance (67.9%), and additional payments beyond the Labor Code (66.7%). Budgets for employee social programs remain unchanged at 82.6% of companies, while 9.3% report an increase and 8.1% report a reduction.
Two-thirds of surveyed companies implement additional measures to reduce labor market tensions. More than half (52.1%) provide internships, 40.4% invest in advanced training for employees, and one-fifth organize temporary employment programs.
According to the latest survey conducted by the Russian Union of Industrialists and Entrepreneurs (RSPP) in February 2026, the Composite Business Climate Index stands at 45.5 points, having risen by 1.4 points over the month. Despite the increase, the index remains below the 50-point threshold, indicating that prevailing business conditions continue to be weighed down by negative assessments.
Product Market and Pricing Trends
The Product Market Index stands at 45.3 points, having gained 1.5 points. In contrast, the procurement price indicator continues its downward trend, losing 0.6 points to reach 18.2 points, with two-thirds of respondents again reporting an increase in procurement costs. Selling prices, however, show consistent positive momentum, adding 1.8 points to reach exactly 60.0 points.
Demand and Competition
Demand conditions remain largely stable, with 55–57% of companies reporting no change in either sectoral or company-specific demand over the month. Approximately 14.7% of organizations note an increase in sectoral demand, while 17.9% see growth in demand for their own products or services. Nevertheless, negative responses still outweigh positive ones, keeping the demand indicators below 50 points at 41.8 and 44.2, respectively. The competition level indicator rises by 1.2 points to 62.4 points.
Orders and Contractual Obligations
The B2B index stands at 45.1 points, slightly down from the previous month, while the new orders indicator holds steady at 52.4 points, with a quarter of companies reporting an increase. However, order fulfillment timelines worsen, with the corresponding indicator dropping 2.5 points to 45.0 points, as 13.7% of companies report longer production times. The share of firms reporting an increase in outstanding obligations to counterparties rises by 5.7 percentage points to 13.7%, pulling the indicator down 1.9 points. The indicator for counterparty non-fulfillment of obligations remains unchanged at 37.9 points.
Logistics and Inventory
The Logistics Index stands at 47.2 points, having gained 0.9 points. The share of negative assessments of overall logistics conditions falls to 16.7%, contributing to a 3.9-point rise in that sub-indicator to 43.9 points. Inventory levels remain in positive territory, increasing by 1.9 points to 56.6 points. Conversely, average delivery times continue to decline, falling to 42.4 points, with 14.7% of companies reporting longer delivery periods.
Government and Financial Relations
The B2G (Business-Government) Index returns to positive territory, climbing 2.2 points to 51.8 points, driven by a 5.4-point increase in the business-government relations indicator, which reaches 57.6 points. Assessments of relations with banks and foreign partners remain in negative territory, though the gap between positive and negative responses narrows, with indicators at 48.4 and 49.2 points, respectively.
Financial Markets and Corporate Health
The Financial Markets Index stands at 45.3 points, having risen by 0.6 points. The financial position of companies improves by 0.6 points to 43.4 points, with 13.7% reporting better conditions, while 27.4% see deterioration. The stock market indicator gains 2.8 points to 47.5 points, while the currency market indicator continues its negative trend, falling 1.5 points to 45.0 points.
Personal Business Climate Assessments
The share of positive personal assessments of the business climate increases by 6 percentage points to 10%, raising the Personal Assessments Index by 4.5 points to 38.2 points. The majority of respondents (56.8%) see no change in the business climate.
Social and Investment Activity
Two-thirds of surveyed enterprises are implementing investment programs in February. Among them, 77.5% are proceeding without changes to schedules or budgets, while 17.5% report delays. One-tenth of companies increase investment volumes, while 5% are forced to reduce them.
Hiring activity is reported by 83.2% of organizations. Layoffs are implemented by 12.6% of companies, and the same share take measures to reduce working hours. Social programs for employees are in place at 82.1% of firms, with the most common measures being vouchers for health and children’s recreation (80%), voluntary health insurance (71.1%), and additional payments beyond the Labor Code (60%). Budgets for employee social programs remain unchanged at 80.4% of companies.
Additionally, 40% of companies implement additional measures to reduce labor market tensions, with one-third providing internships and 30.5% offering advanced training for employees.
The year 2025 marked a pronounced slowdown in the Russian economy, following a period of robust growth in 2024. According to Rosstat’s preliminary estimates, GDP growth decelerated to 1% in 2025 from 4.9% in the previous year. Industrial production growth fell from 5.1% to 1.3%, while manufacturing growth declined even more sharply from 9.1% to 3.6%. The most acute cooling occurred in the third quarter of 2025, reflecting the cumulative effect of the Bank of Russia’s tight monetary policy, which constrained consumer demand and business lending, subsequently weighing on investment activity. Additional contributing factors included fiscal consolidation following a peak in government spending, ongoing sanctions pressure, and a decline in oil and gas exports.
The trajectory of the Central Bank’s key interest rate proved to be the defining factor shaping economic conditions throughout the period. Having risen from 16% in February 2024 to a historic high of 21% in October 2024, the rate began a gradual easing cycle only in June 2025, declining first to 20% and then to 18% by late July, before further adjustments brought it to 16% by the end of the year. The Central Bank justified these moves by citing slowing core inflation and stabilizing credit risks, while maintaining hawkish rhetoric to anchor inflation expectations.
The RSPP’s Composite Business Climate Index demonstrated a clear inverse correlation with the key interest rate and a close alignment with broader macroeconomic trends. During March through May 2024, the Composite Index rose above the 50-point threshold, signaling an improvement in business conditions relative to the previous period, with positive assessments outnumbering negative ones. During this time, the component indices—Product Market, B2B, B2G, and Personal Assessments—also exceeded 50 points, while the Financial Markets and Logistics indices approached the threshold.
Beginning in June 2024, when the Composite Index fell to 49.6 points, a sustained decline set in, culminating in a year-low of 45.4 points in December 2024. This structural shift was initially driven by deteriorating assessments of financial markets and personal evaluations of the business climate, which remained the primary drag throughout the second half of 2024, while other indicators proved more resilient before gradually turning negative.
The year 2025 was characterized by stagnation, with the Composite Index ranging between 45.6 and 47.1 points—values below 50 indicating that each successive period was perceived as worse than the previous one. A peak of 47.1 points in March, supported by improved personal assessments and better evaluations of financial conditions and logistics, was followed by a renewed downturn in April. By July, the Composite Index had fallen to 46.0 points, driven primarily by worsening assessments of market conditions and the B2B sector. From July through December, the index stabilized at approximately 46 points, with positive contributions from business-government relations, relations with financial institutions, and logistics, offset by persistent negative trends in market indicators, personal assessments, and financial metrics. The average deviation from the 50-point threshold widened from -1.5 points in 2024 to -3.8 points in 2025.
Product Market Index
The Product Market Index remained in positive territory until October 2024, with the highest readings recorded between March and May of that year. Growth in both sectoral and company-specific demand, reported by roughly 30% of companies month after month, drove the positive momentum. From September 2024 onward, demand growth began to moderate, though it remained above the 50-point threshold until March 2025. Selling prices and competition levels also contributed positively to the index in 2024, while procurement prices consistently acted as a drag, with a persistently high share of respondents reporting inflationary pressure. The index first dipped below 50 points in November 2024, coinciding with worsening procurement price assessments and a deceleration in demand growth.
From April 2025, demand indicators turned negative as neutral and negative assessments gained the upper hand, and the share of companies reporting increased demand steadily declined. Although procurement price assessments improved, this failed to offset the impact of contracting demand, and companies also began reporting worsening selling price dynamics. The Product Market Index fell to 48.7 points in April 2025 and continued to decline, reaching a low of 44.4 points in August 2025. A modest recovery to 45.2 points followed in October, with the index stabilizing around that level for the remainder of the year.
B2B Index
Like the Product Market Index, the B2B Index stood above 50 points in the first half of 2024, but it crossed below the threshold earlier, in July 2024. Negative trends subsequently intensified, with the index declining steadily until August 2025, when it bottomed out at 45.6 points. A modest correction began in autumn 2025, with the index rising gradually by 0.2 to 0.5 points per month to reach 46.9 points in December.
The most significant downward pressure came from the indicator measuring counterparty non-fulfillment of obligations. The share of companies reporting an increase in overdue obligations from counterparties rose steadily from 11–20% in the first half of 2024 to 16–30% in the second half. In 2025, between 26% and 33% of companies faced rising overdue obligations, with peaks in July, October, and December. From September 2024 onward, this indicator consistently scored below 40 points.
Obligations owed to counterparties also showed deterioration. While this indicator frequently exceeded 50 points in 2024—meaning more companies reported a decrease rather than an increase in overdue obligations—the trend turned negative from August 2024 onward. The most challenging period came in April 2025, when 19% of respondents reported an increase in overdue obligations to counterparties, compared with only 7% reporting a decrease. Conditions became more balanced thereafter, with positive assessments prevailing in July–September and November 2025, though by a narrow margin of just 2 percentage points.
The new orders indicator, previously a consistent driver of B2B index growth, weakened significantly in 2025. The share of companies reporting an increase in new orders, which had stood at nearly one-third in previous periods, fell from 25% in December 2024 to a range of 20–25% in the first five months of 2025, before dropping sharply to 16% in June. Meanwhile, the share of companies reporting a decline in new orders increased, narrowing the gap between positive and negative responses. By August 2025, positive and negative assessments were evenly balanced, and in September and October, negative assessments prevailed. A slight stabilization occurred in the final two months of the year, with the share of companies reporting growth in new orders rebounding to 25%, though 21% of companies continued to experience contracting incoming demand and sales efficiency.
Logistics Index
Throughout 2024, the Logistics Index remained below 50 points, with the highest readings recorded in February through April, when the deviation from the threshold stood at less than 1.6 points. The index dipped to lows of 47.3–47.5 points in the summer before beginning a gradual recovery. In 2025, the positive trend strengthened, and between May and August, the index moved into positive territory, helping to stabilize the overall Composite Index alongside the B2G index.
The inventory levels indicator was the primary driver of this improvement, consistently scoring above 50 points in both years and rising to 57–59 points between July and October 2024 and again between May and September 2025. Delivery times and overall logistics conditions also received significantly more favorable assessments during May–September 2025. Key developments in the logistics sector included accelerated automation and digitalization, with widespread adoption of AI-powered warehouse and transport management systems, development of multimodal transport, reorientation of supply chains toward eastern corridors supported by modernization of the Eastern range, expansion of container shipping to Asia-Pacific markets, and construction of new logistics hubs in Moscow, the Far East, and Tatarstan. However, the positive momentum halted in autumn 2025, and by December the Logistics Index had fallen back to 47.5 points.
B2G Index
The B2G Index was distinguished by the highest share of neutral responses of any component, with 85–90% of companies consistently reporting no change in their relations with financial institutions, government bodies, and foreign partners. Nevertheless, fluctuations in the remaining share of positive and negative assessments, driven by political developments, monetary policy decisions, and international events, caused notable swings in the index.
Assessments of business-government relations remained consistently positive throughout the period, never falling below 50 points, thereby providing a foundation of stability for the B2G Index. However, this positive influence was offset by the dynamics of the other two component indicators: relations with financial institutions and relations with foreign partners.
Relations with financial institutions remained above 50 points until June 2024, when the key interest rate stood at 16%. Following the Central Bank’s rate hike to 18% in July 2024, assessments deteriorated, and the indicator fell below 50 points. Further rate increases in 2024 prompted continued negative responses, with a clear correlation between business assessments and Central Bank actions. This deterioration pushed the B2G Index into negative territory in July 2024, where it remained for the rest of the year, with a brief respite in February–April 2025. Once the rate-cutting cycle began, assessments of relations with financial institutions improved, with the indicator rising above 50 points in August 2025 and continuing to climb, supporting growth in the overall B2G Index.
Relations with foreign partners exhibited a clear correlation with the timing of new sanctions packages. In the second half of 2024, following sanctions targeting over 400 entities, including Arctic LNG 2 and the shadow fleet, as well as energy-related restrictions affecting Nord Stream 2, the indicator fell to lows of 43–45 points. Subsequent adaptation to the new conditions and reorientation toward alternative markets led to a gradual recovery, though the indicator remained below 50 points throughout 2024–2025, reaching approximately 47–47.8 points by the end of 2025.
The B2G Index thus experienced several distinct phases: it exceeded 50 points in early 2024, peaking at 51.7–51.8 points in March–April, before declining to a low of 47.3 points in November 2024. A recovery followed, with the index plateauing between February and August 2025, fluctuating within a narrow range, before embarking on a sustained rise from September 2025 to reach 51.3 points by year-end.
Financial Markets Index
The Financial Markets Index approached the 50-point threshold in February–April 2024, reaching a high of 49.4 points in March. A sustained decline followed, with relatively moderate monthly losses of around 0.7 points from May through October, followed by sharper drops of 1.6 points in October, 2.7 points in November, and another 1.6 points in December, bringing the index to a year-end low of 39.7 points—a 17% decline from its starting level. A slow recovery ensued in 2025, with the index rising to a peak of 45.6 points in April. A second wave of decline occurred in the summer, pulling the index down to 44.1 points in August, before it finally climbed back above 45 points in November and December.
The negative trend in the first half of 2024 was driven primarily by deteriorating assessments of currency and stock market conditions. The sharpest declines in October–December 2024, however, were closely tied to a rapid deterioration in companies’ own financial position assessments. This indicator, which had remained above 50 points in the first three quarters of 2024, began to fall in October and dropped to 43 points by December 2024, a level at which it remained throughout most of 2025.
A significant inflection point occurred in November 2024, when the share of companies reporting a deterioration in their financial position overtook the share reporting improvement for the first time, with roughly one-quarter of respondents giving negative assessments compared with only 12% positive. In December, the distribution remained similar, and in January 2025, the share of negative assessments rose to 29%, while positive assessments edged up to 16%. Throughout 2025, the share of negative assessments ranged between 20% and 29%, with companies consistently more than twice as likely to report deterioration as improvement. This worsening likely reflected a combination of factors, including higher borrowing costs due to tight monetary policy, increased debt burdens, declining profitability, cooling demand, and rising operating costs.
The currency market indicator began to decline in May 2024, losing 1–2 points per month to reach a low of 34.8 points in December 2024. Conditions improved from March 2025 onward, with the indicator rising to 45.8 points and stabilizing in that range through September, before a positive trend emerged in the final quarter, lifting the indicator to 48.6–48.7 points by year-end. These assessments aligned with actual currency market dynamics: the ruble weakened progressively in 2024, pressured by sanctions that disrupted trading on the Moscow Exchange and pushed the market toward Chinese yuan and exchange-traded funds, alongside rising import demand and oil price corrections. The ruble fell 13.37% over the course of the year. In 2025, the currency stabilized following the Central Bank’s rate cuts and the elimination of repatriation requirements, strengthening in the second half and ending the year at a low of 75.34 rubles per USD.
Assessments of stock market conditions followed a similar trajectory, albeit with less volatility. The indicator reached its lowest levels between October 2024 and January 2025, ranging from 40 to 42 points, before recovering slowly to 47–47.3 points in November and December 2025. Stock market performance in 2024 was weighed down by sanctions against the Moscow Exchange and high interest rates, though an IPO boom in the final quarter provided some offset. In 2025, a recovery in IPO activity and declining rates supported stabilization, though geopolitical factors continued to constrain a full rebound.
Personal Assessments Index
The Personal Assessments Index remained the most reactive and volatile of all the RSPP business climate indices, reflecting respondents’ subjective reactions to the evolving national situation and current agenda. Its dispersion was significantly wider than that of other indices. For the first time in the survey’s history, the index entered positive territory between March and May 2024, but subsequently declined more sharply than any other component, falling to a low of 38.8 points in December 2024. A recovery to 43 points followed by March 2025, but the index then resumed its decline along a more gradual trajectory, ultimately ending the year at 38.8 points—matching the level recorded in late 2024. In the final quarter of 2025, approximately one-third of respondents consistently gave pessimistic assessments, perceiving a continuous deterioration in the business climate, while half reported no change.
In December 2025, the Russian Union of Industrialists and Entrepreneurs (RSPP) recorded a marginal decline in its composite Business Environment Index, which fell by 0.5 points to 46.1 points. The survey of industrial and business leaders revealed a notable softening in core economic activity, driven primarily by a contraction in demand.
The most significant pressure came from the Product Market Index, which dropped 3.6 points to 43.8. Respondents reported a marked decrease in both sector-wide demand and demand for their own products and services. The share of companies reporting reduced demand rose by approximately 10 percentage points compared to November. Consequently, the "industry demand" indicator fell sharply to 39.1 points from 45.5, while "demand for a company's own products/services" plummeted to 40.0 points from 49.2.
Input cost pressures persisted, with the "purchase prices" indicator falling to 28.5 points (-2.1), as nearly half of surveyed firms noted an increase. In contrast, selling price momentum weakened: the "selling prices" indicator fell 2.7 points to the neutral threshold of 50 points, with 68.2% of firms reporting stable prices. The proportion of companies raising prices declined to 16.5% from 19.2% in November.
Operational indicators presented a mixed picture. The "level of competition" component rose 1.9 points to 61.2, returning to its October level. However, the B2B Index declined by 2.2 points to 46.5, and "new order volume" fell 2.5 points to 51.8, with a growing share of companies (21.2%, up from 14.9%) reporting a decrease. The indicator for "fulfillment of obligations by companies" dipped into negative territory at 47.1 points, with a 5%-point increase in firms reporting more unmet obligations.
The logistics sector showed signs of stabilization. After two months of decline, the Logistics Index rose 2.9 points to 49.0. This was supported by a significant improvement in "inventory levels," which jumped 5.6 points into positive territory at 53.2. However, "average delivery time" remained a challenge, inching up 3 points to 48.5.
A notable bright spot emerged in external relations. For the first time in four years, the indicator for "relations with foreign partners" entered positive territory at 51.5 points, with 8.2% of companies noting an improvement. The B2G (business-to-government) Index also remained positive for the second consecutive month at 53.0 points, reflecting slightly more optimistic assessments of business-state relations.
Financial market sentiment softened, with the corresponding index losing 1.1 points to settle at 45.4. The "financial position of companies" indicator declined to 41.8 points, as more firms (27.1%, up from 21.2%) reported a deterioration in their financial standing.
Social and Investment Activity, Stability Amid Challenges
On the investment front, 67.1% of companies maintained active investment programs, with two-thirds executing them without changes to schedule or budget. However, 14.5% were forced to reduce investment volumes, slightly outpacing the 12.5% that increased spending.
The labor market demonstrated resilience, with 77.6% of companies hiring new staff and only 9.4% reporting layoffs. A significant 89.4% of organizations maintained social programs for employees, the most common being subsidized resort/child recreation (71.1%), voluntary health insurance (64.5%), and extra-contractual payments to staff (59.2%). Budgets for these programs remained unchanged for 77.9% of firms.
Furthermore, 62.4% of companies participated in additional measures to ease labor market tensions, primarily through internships (49.4%) and advanced training programs (36.5%).
In summary, the December 2025 survey depicts a business environment dealing with weakening demand and financial pressures, offset by stable investment, a resilient labor market, and cautious optimism regarding logistics and certain external relations.
For more details, click
MOSCOW – Russia’s business environment showed tentative signs of stabilization in November 2025. According to the latest survey from the Russian Union of Industrialists and Entrepreneurs (RSPP), the key Composite Business Climate Index halted its decline, returning to its September level of 46.6 points. This apparent stabilization, however, conceals a more complex reality, where encouraging signals from core business operations are offset by enduring constraints in logistics and a cautious investment climate.
Improving Market Conditions and Pricing
The performance of the product market index rose by 1.8 points to 47.4. This was underpinned by a significant rebound in the B2B Index, which jumped 4.4 points to 48.7 after recently hitting a three-year low. Both demand within industries and for companies' own products saw positive shifts, with the latter nearing the 50-point threshold that separates contraction from expansion.
Pricing dynamics also improved. While purchase prices increased, the number of respondents reporting price hikes actually fell by 6%. More significantly, the sales price index entered positive territory, climbing to 52.7 points, suggesting companies are finding slightly more room to pass on costs.
Strengthening Contracts and Orders
Business reliability saw a marked improvement. The index for companies fulfilling their obligations surged 5.6 points to 51.6, re-entering positive assessment territory. Reports of growing unmet obligations halved, and a similar positive trend was noted for counterparties' reliability. This renewed confidence was reflected in new orders. The new orders index broke a two-month negative streak, leaping 6 points to a positive 54.3, driven by a 7.5% increase in companies reporting more orders.
Logistics and Competition: Emerging Pressure Points
However, not all signals were positive. The Logistics Index continued its gradual decline to 46.1 points. For the first time in two years, the assessment of warehouse inventory levels fell into negative (47.6 points), with fewer companies reporting improvements. This was partly offset by a slight improvement in overall logistics sentiment and delivery times. Furthermore, the competitive landscape intensified, with the level of competition index falling 2.1 points to 59.3.
Financial Sector and External Relations
The financial markets index showed a solid recovery, gaining 4.1 points to 46.5. Assessments of companies' own financial positions improved noticeably; the share of firms reporting a deterioration fell from over a quarter to a fifth, pulling the index up to 43.1 points. The stock market index also saw a sharp rebound of 6.6 points, as the number of negative assessments plummeted.
While the overall appraisal of relations with foreign partners remains marginally in negative territory, it improved significantly as the proportion of negative assessments fell by half.
Social and Investment Activity: A Mixed Picture
The social and investment sphere presented a contrasting view. On one hand, the proportion of companies running investment programs fell by 5.3 percentage points to 57.4%. However, among those investing, three-quarters reported sticking to their original schedules and budgets, and far fewer companies were forced to cut investment volumes.
Hiring remained robust, with 77.7% of companies recruiting, returning to September's levels. Social programs for employees were widespread (85.1% of companies), with the most common forms being extra-contractual payments, sanatorium vouchers, and private health insurance. For most companies (80.5%), social spending budgets remained unchanged.
To summarize, the Russian business landscape in November 2025 was characterized by a tentative recovery, driven by improved demand and operational reliability. Nonetheless, this progress remains vulnerable to enduring headwinds, most notably in the logistics sector, a highly competitive market, and a discernible pullback in corporate investment.
For more details, click
The Russian business environment deteriorated to its lowest point this year, according to the latest Business Climate Index from the Russian Union of Industrialists and Entrepreneurs (RSPP). The composite index fell to 44.3 points in October, signaling growing pessimism among industrialists and entrepreneurs, primarily driven by a worsening crisis in payment discipline between companies.
The survey results paint a picture of an economy facing internal strain, even as some external pressures have stabilized. The dynamics of demand were mixed: while perceived demand across entire industries fell, a slightly larger share of companies (20.3%) reported a rise in demand for their own products compared to those who saw an increase in broader sectoral demand (16%).
Deepening Corporate Illiquidity
The most alarming data comes from the B2B Index, which plummeted to a three-year low of 44.3 points. This decline is directly attributed to a sharp deterioration in the fulfillment of contractual obligations. The indicator measuring companies' own default rate fell by 5.6 points, while the metric for counterparties' defaults dropped 3.7 points to a very low 34.7 points. Crucially, the balance of responses shifted negatively: in October, 10% of firms reported an increase in their own unmet obligations (double the 5% that saw a decrease), and a full third of respondents reported a rise in defaults by their partners.
Logistics and Financial Pressures Mount
After five months in positive territory, the Logistics Index fell back into negative assessment, dropping to 46.5 points. This was largely due to a significant drawdown in warehouse inventories and longer average delivery times, suggesting companies are de-stocking amid uncertainty.
The financial outlook for companies also darkened. The "financial position of companies" indicator fell to 39 points, with over a quarter of respondents reporting a worsening of their financial health. The state of the stock market was assessed at 41.3 points, with 16.1% of businesses noting a negative dynamic and not a single respondent reporting an improvement. The only faint positive note in the financial sector was a slight stabilization in the currency market, which most companies (90.7%) described as unchanged.
Reflecting this challenging environment, the Personal Assessment Index fell to 36.9 points. A significant 31.3% of business representatives believe the country's business climate has worsened, while only 7.6% hold a positive view.
Investment and Social Activity: A Glimmer of Resilience
Despite the gloomy business climate, the data on corporate activity reveals a degree of resilience. Two-thirds of organizations continued to implement investment projects, with the majority (67.9%) doing so without changes to their schedule or budget. However, one-fifth of companies were forced to cut investment volumes.
The labor market showed strength, with 87.3% of companies reporting new hiring, a significant 12.3% increase from the previous period. Layoffs were reported by only 6.8% of organizations.
Social support for employees remains widespread, with 85.6% of companies maintaining such programs. The most common benefits are voluntary health insurance (66%), additional payments beyond legal requirements (63.1%), and subsidized vacation packages and children's camps (59.2%). For most companies (76.4%), spending on these social programs remained unchanged, though 14.5% managed to increase their budgets.
In summary, the October 2025 survey depicts a Russian business sector grappling with a severe internal liquidity crunch and logistical setbacks. While investment and employment have so far held relatively steady, the collapse in payment discipline and worsening financial assessments point to underlying vulnerabilities that threaten the economy's stability as the year draws to a close.
For more details, click
In September 2025, the Russian Union of Industrialists and Entrepreneurs (RSPP) released findings from its latest survey of industrialists and entrepreneurs, offering insights into the state of Russia's business landscape. The Composite Business Environment Index held steady at 46.6 points, a marginal increase from 46.5 points in August, signaling a stable yet cautious economic climate.
The Market of Manufactured Products Index saw a modest rise of 1.9 points to 45.7, driven by positive demand trends. Industry-wide demand improved notably, climbing 4.8 points to 46.2, with 21.4% of respondents reporting growth compared to just 14.8% in August. However, demand for individual company products grew more slowly, up 1.8 points to 44.2, with only 18.8% of businesses noting an increase. Procurement prices edged up slightly to 24.8 points, while sales prices dipped by 1.4 points, reflecting fewer companies raising prices. Competition intensified, with the level of competition indicator rising 4.4 points to 63.3, as a quarter of respondents observed heightened competitor activity.
The B2B Index slipped slightly to 46.4 points from 46.9 in August. New orders weakened, falling to 45.5 points, with 23.2% of companies reporting a decline compared to 17.7% the previous month. On a positive note, production timelines improved, reaching a neutral 50 points, up 2.8 points. The fulfillment of obligations to counterparties remained solid at 51.6 points, though a persistent 13.2-point gap highlighted challenges in counterparty reliability, with nearly 30% of firms noting increased unfulfilled obligations.
Logistics showed resilience, with the Logistics Index holding in positive territory at 50.7 points for the fifth consecutive month. Warehouse stock levels stood at 57.4 points, with one-fifth of companies reporting increases. Delivery times improved marginally to 47.1 points, with 5% of firms reducing delivery times compared to 2.8% in August. Overall, the logistics sector's outlook brightened, with its assessment rising by 1.9 points.
The B2G Index, reflecting business-government relations, remained stable at 51.6 points. Approximately 85% of respondents reported no significant changes in ties with financial institutions or government bodies, though nearly 10% noted slight improvements. Relations with foreign partners saw a more positive shift, with the indicator rising from 47.9 to 49.1 points.
The Financial Markets Index stayed nearly flat at 44.5 points. However, the financial position of companies deteriorated slightly to 41.7 points, with 26.8% of firms reporting a worsening situation, up from 20% in August. Stock and currency market indicators showed minimal change, rising to 46 and 45.8 points, respectively, with over 85% of respondents viewing these markets as stable.
Personal assessments of the business climate took a hit, dropping 2.6 points to 40.5, with 30.4% of respondents noting a decline, a 6% increase in negative sentiment. Investment activity remained consistent, with 63.4% of companies engaged in projects, two-thirds of which proceeded on schedule and within budget. However, a quarter of firms lagged behind, and one-fifth reduced investment budgets, though 13.9% increased spending.
Hiring trends softened, with 75% of companies recruiting, down from 80% in August and 85% earlier in the year. Layoffs rose, affecting 10% of firms, up 7% from prior months. Cost-cutting measures, such as reduced working hours, were implemented by 10.8% of organizations. Social programs remained robust, with 80.4% of companies supporting employees through benefits like spa vouchers (69.2%), additional payments (67%), and voluntary health insurance (62.6%). Nearly half of the firms also supported broader community initiatives.
The September 2025 survey paints a picture of a business environment marked by cautious optimism, with gains in logistics and competition offset by softening demand, financial pressures, and declining confidence.
As companies navigate these dynamics, the focus on investment and social programs underscores a commitment to resilience amid uncertainty.
For more details, click
In August 2025, Russia's business environment exhibited signs of cautious optimism, with the overall Composite Index edging up by 0.7 points to 46.5, according to a survey by the Russian Union of Industrialists and Entrepreneurs (RSPP). Despite this slight improvement, the index remains below the 50-point threshold, indicating that a negative assessment continues to prevail among businessmen.
The landscape of demand presented a contradictory picture. While perceived demand within industrial sectors saw an improvement, the demand for companies' own products and services fell significantly. This decline is attributed to a notable increase in the number of respondents reporting a drop in orders for their goods. The pressure on businesses continued from the cost side, with a majority of 51.8% reporting rising input prices, causing the corresponding index to fall. In contrast, selling prices remained largely stable, hovering in slightly positive territory.
Operational indicators were mixed. In a positive development, the volume of new orders received by companies crossed into positive territory for the first time, marking a significant monthly improvement. However, companies reported a slight easing in competitive pressures and a minor lengthening in order fulfillment times. The logistics sector sent conflicting signals; while warehouse inventory levels rose substantially and the overall logistics index was stable, qualitative assessments of the logistical situation itself worsened, with more businesses reporting deterioration than improvement.
A notable bright spot was the relationship between businesses and the state. The B2G Index returned to positive ground, driven by a slight preponderance of positive over negative responses regarding interactions with both financial institutions and government bodies. Financially, companies reported a modest improvement in their own financial positions, though perceptions of the stock and currency markets remained neutral to negative. This contributed to a significant jump in personal optimism, with the index of personal assessments rising sharply as negative views on the country's business climate contracted.
Beyond immediate business concerns, the survey revealed robust investment and social activity. Nearly two-thirds of respondents were actively pursuing investment projects, and crucially, a overwhelming 82% of them were doing so without any delays or budget overruns—a significant increase from the previous month.
The labor market appears stable, with an overwhelming majority of companies hiring and only a small fraction reporting layoffs. Social programs for employees are widespread, with 86.1% of companies offering benefits such as extra payments, health insurance, and vacation vouchers. Most companies held their social spending steady, and a strong majority also engaged in additional measures to support the labor market, primarily through employee internships and advanced training programs.
In summary, the August 2025 data paints a picture of an economy finding a fragile equilibrium. Businesses are navigating persistent cost pressures and uneven demand but are responding with stable investment, hiring, and social support, all while expressing a slightly more optimistic outlook for the future.
For more details, click
The latest survey by the Russian Union of Industrialists and Entrepreneurs (RSPP) reveals a slight deterioration in business sentiment during July 2025, with the composite Business Environment Index declining by 1.4 points to 45.8 points. This downward trend reflects growing caution among industrialists and entrepreneurs, driven primarily by weakening demand and ongoing price pressures. While selling prices showed modest improvement, rising to 51.1 points and re-entering positive territory, purchase prices remained depressed at 28.5 points despite nearly half of surveyed firms reporting continued cost increases. The B2B sector remained stagnant, with new orders dropping further to 46.8 points, indicating persistent challenges in securing business.
Logistics performance presented a mixed picture. Although the Logistics Index maintained its positive trend for the third consecutive month at 50.4 points, delivery times worsened significantly, with the indicator falling to 44.1 points. Nearly 14% of companies reported longer shipping delays, up sharply from 6.8% in June. Meanwhile, government-business relations showed volatility, with the B2G Index slipping to 49.2 points, just below the neutral threshold. Financial market sentiment also softened, with the Financial Markets Index dropping to 44.1 points as companies expressed greater concern about their financial positions.
On the investment front, two-thirds of surveyed enterprises maintained their capital expenditure programs, with most reporting adherence to original schedules and budgets. However, nearly 20% were forced to scale back investments, outweighing the 4.5% that increased spending. The labor market demonstrated resilience, with 85% of firms continuing to hire, though a small but notable 7.5% implemented layoffs or reduced working hours. Social programs remained widespread, with 84% of companies offering employee benefits ranging from healthcare support to housing assistance. The vast majority of companies kept social budgets unchanged, signaling stability in corporate welfare commitments despite broader economic headwinds.
The business climate faces challenges from softening demand, supply chain disruptions, and strained foreign partnerships. However, the sustained investment activity and robust employment figures suggest underlying resilience in Russia's industrial sector. The coming months will prove critical in determining whether these stabilizing factors can offset the prevailing negative trends in business sentiment.
For more details, click
In June 2025, the Russian Union of Industrialists and Entrepreneurs (RSPP) released its latest survey on the country’s business climate, revealing a mixed yet cautiously optimistic outlook. The Composite Business Environment Index rebounded to 47.2 points, matching its April level after a 1.8-point monthly increase. While certain sectors demonstrated resilience, others faced persistent challenges, reflecting the complexities of the current economic landscape.
The product market index declined to 44.7 points, marking a 1.1-point drop from the previous month. This downturn was primarily driven by two key factors: a historic low in sales prices (49.3 points, the weakest since July 2020) and a notable decrease in perceived competition levels (61.5 points, down by 6.9 points). However, demand conditions showed modest improvement, with both industry-wide and company-specific demand indicators rising by 2 points. Additionally, companies reported fewer concerns over procurement costs, as the share of negative responses fell by 3.5 percentage points, pushing the corresponding index up to 29.5 points.
The logistics sector remained in positive territory, with the overall index holding steady at 51.4 points. Despite this stability, underlying metrics revealed some strain: average delivery times and inventory levels both dropped by over 2 points, settling at 46.6 and 58.6 points, respectively. Encouragingly, broader perceptions of logistics conditions improved, with the sector sentiment index climbing 3.1 points to 49 points. This shift was attributed to a growing share of respondents reporting logistical improvements—a sign that supply chain bottlenecks may be easing.
The B2B sector saw a slight uptick, with its index rising to 46.1 points (+0.5). However, a concerning development emerged in new orders, which fell into negative territory for the first time in three years (49.3 points, down 2.6 points). This decline coincided with a 5-percentage-point reduction in companies reporting increased order volumes. In contrast, the B2G (business-to-government) index staged a strong recovery, jumping 4.8 points to 51.8. Notably, not a single respondent described government relations as deteriorating—a stark improvement from May’s results.
Financial pressures on businesses appeared to ease slightly, with the financial position index climbing to 44.2 points (up from 41.7 in May). The share of firms reporting worsening conditions dropped from 25% to 20.5%, signaling tentative stabilization. Meanwhile, investment activity remained steady, with over 63% of companies continuing their programs—71.2% of which adhered to original schedules and budgets. Nevertheless, one-fifth of firms reduced investments, underscoring lingering caution.
Employment trends remained robust, with 83.6% of surveyed organizations actively hiring and none reporting layoffs. Companies also maintained strong social commitments: 93.2% ran employee support programs (including bonuses, healthcare, and housing aid), while 76.7% participated in labor market initiatives like retraining and temporary employment schemes. These efforts reflect a corporate emphasis on workforce stability amid economic fluctuations.
For more details, click here
In May 2025, the RSPP conducted another round of survey among industrialists and entrepreneurs, revealing a composite index of 45.4 points, 1.9 points less than the value obtained in the last reporting period. The negative dynamics of the RSPP Index are associated with a sharp decline in demand, deterioration in the B2G sector, and fluctuations in the currency market.
The index of the market of manufactured products dropped by 3.8 points on the scale, with respondents expressing significantly worsening demand than a month ago. The B2B Index rose 0.5 points to 45.6 points, while the Logistics Index moved into the positive assessment zone, gaining 51.8 points (+3.4 points).
The B2G index dropped to 47 points in the reporting period, with all indicators showing a decline, but the dynamics of the index characterizing the relations between Russian business and foreign partners look the worst. The Financial Markets Index fell by 2.8 points to 44.1 points, with a quarter of respondents stating that their companies' financial situation has deteriorated.
In terms of social and investment activity, more than two-thirds of enterprises participated in the survey in May 2025. Investment programs were implemented by more than two-thirds of the enterprises, with 63.6% of companies implementing projects without any changes in the schedule or budget. However, 18.2% of companies reported falling behind schedule, while 4.5% were ahead of schedule.
86.8% of organizations hired employees, and 5.5% used measures to reduce working hours to optimize costs. Social programs for employees were in place in 84.6% of organizations, and programs aimed at supporting other categories of citizens in 59.3% of companies.
Three quarters of organizations kept the budget for social programs unchanged, while 16.7% reported an increase in expenditures and 7.7% of surveyed enterprises reduced the budget. 75.8% of companies participated in the implementation of additional measures to reduce tension in the labor market, with more than half sending employees for internships and 48.4% engaged in advanced training.
For more details, click here
The Russian Union of Industrialists and Entrepreneurs conducted another round of surveys among industrialists and entrepreneurs in April 2025. The value of the Composite Index decreased slightly – by 0.3 points to 47.3 points.
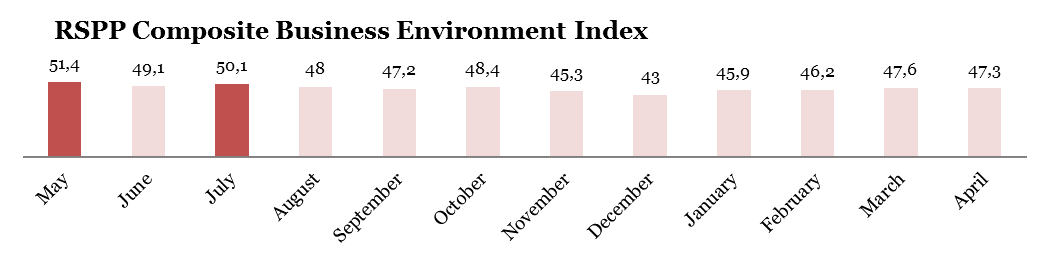
The index of the manufactured products market amounted to 49.6 points, its value increased by 1.9 points over the month.
The "purchase price" indicator dropped by 2.4 points on the scale to 18.8 points.
59.4% of respondents reported that purchase prices continued to rise during the reporting period. The rest of the survey participants chose the answer "the situation has not changed."
The value of the "selling prices" indicator is 62.3 points against the March value of 59.9 points. According to the survey results, 31.9% of companies have raised prices for their products or services. A month ago, less than a quarter of the respondents stated this.
Demand indicators – in the industry and for the products of the companies themselves – rose by 1.2 and 2.3 points on the scale, reaching 49.3 and 50.4 points, respectively.
Demand for products or services increased in 23.2% of companies. The respondents chose negative ratings a little less often – in 21.7% of cases. More than half of the participants (55.1% of enterprises) assessed the demand situation neutrally.
The value of the "level of competition" component of the Index immediately increased by 5.9 points, eventually reaching 67 points (and this is the maximum for the last seven years of the study).
The dynamics of the B2B Index is negative again, its value fell by 0.6 points to 45.1 points.
This is due to the deterioration of the situation with the fulfillment of obligations, both on the part of companies and on the part of counterparties. In the first case, the indicator was 44.2 points, in the second – 36.2 points. Both values decreased by more than 2 points.
73.9% of respondents noted that the situation with the fulfillment of obligations to counterparties remained the same. In 18.8% of companies, there were more outstanding obligations, and only in 7.3% of organizations, on the contrary, their number decreased.
The share of companies that found it more difficult to fulfill their obligations to counterparties than it was in March increased by 7 percentage points.
Almost 30% of the enterprises participating in the survey faced non-fulfillment of obligations on the part of counterparties during the reporting month. The share of such responses added 4 percentage points.
The number of new orders increased in a quarter of companies. 62.3% of respondents chose the option "the situation has not changed". A month ago, participants were less likely to choose a positive answer. Due to the redistribution of ratings, the indicator rose up the scale to 54 points.
The indicator "deadlines for completing current orders" amounted to 46 points (+0.3 points compared to the March value).
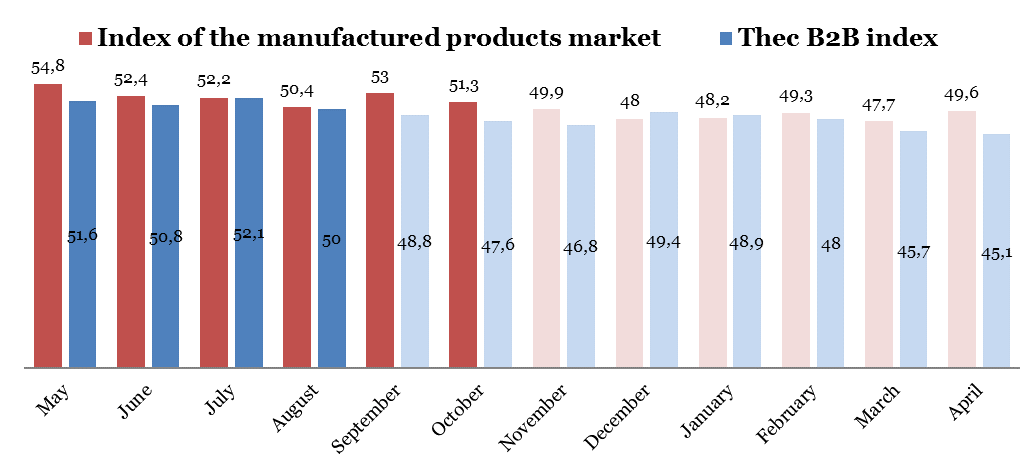
The value of the Logistics Index rose to 48.4 points, adding 0.7 points.
The average delivery time remained unchanged, according to the estimates of the majority of respondents – 82.6%. An increase in time spent on delivery was reported by 14.4% of companies. In only 2% of organizations, product delivery began to take less time. Compared to the data obtained in March, respondents were less likely to choose negative assessments. Accordingly, the value of the indicator increased by 2 points to 43.8 points.
The "inventory level" indicator maintains its position in the positive assessment zone, amounting to 56.2 points (+0.7 points).
At the same time, respondents rated the overall state of logistics slightly worse than in the previous reporting period, with the value of this component of the Index falling by 0.4 points to 45.3 points.
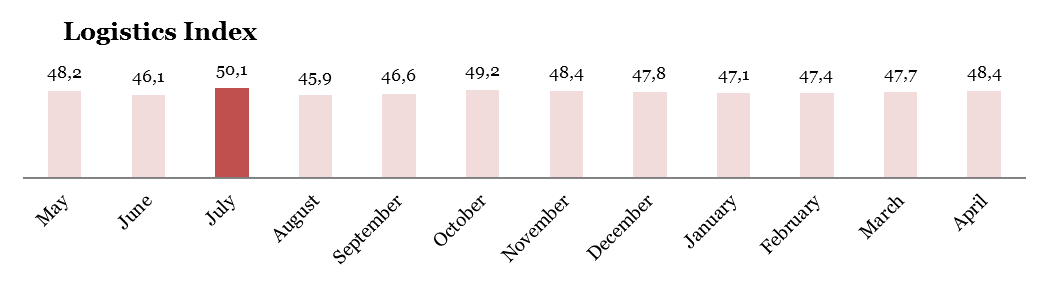
The B2G index has been in the positive assessment zone for the second month, its value has added another 1.1 points. As a result, it is equal to 51.4 points.
As in the previous month, this is due to the positive dynamics of indicators characterizing relations with financial institutions and foreign partners.
In the first case, the value of the indicator increased by 1.6 points. 85.5% of respondents settled on a neutral answer, "the nature of relations with banks and financial institutions has not changed." 8.7% of the participants saw an improvement in their relationship, while 5.8% saw a slight deterioration.
For the first time since November 2021, the indicator "relations with foreign partners" has risen on the scale to the boundary mark of 50 points. In the last reporting period, its value was 47.8 points.
88.4% of the respondents chose the neutral answer "the situation has not changed", while the rest of the companies were divided in their opinions – both positive and negative assessments of relations with foreign partners amounted to 5.8% each. A month ago, negative ratings prevailed over positive responses.
There have been no changes in the relationship between business and government, according to 89.9% of companies. 7.2% of the respondents stated an improvement in their relations. 2.9% of respondents indicated negative ratings, and their share increased by 1.9 percentage points.
Due to this redistribution of estimates, the indicator characterizing the dynamics of relations between business and government structures lost 0.5 points.
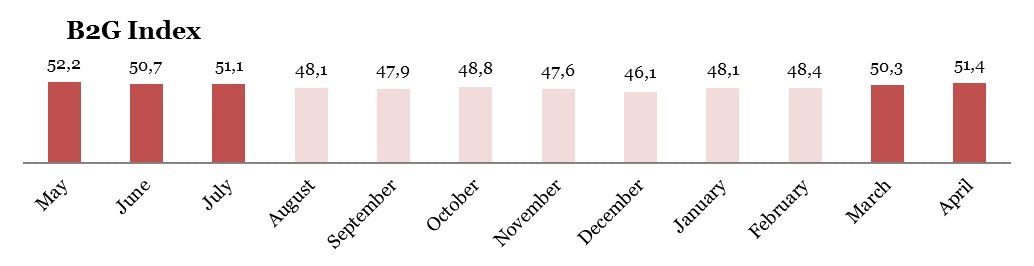
The value of the Financial Markets Index increased by 0.4 points to 46.9 points.
The financial situation has not changed in 69.6% of the surveyed companies. According to the estimates of a fifth of respondents, it has become worse. Accordingly, a tenth of the companies, on the contrary, managed to strengthen their financial position.
The share of negative ratings remained the same, but the share of companies reporting an improvement increased by 3 percentage points over the month.
Due to this, the indicator added 1 point and amounted to 43.8 points.
The estimates of the foreign exchange market also turned out to be shifted to the neutral and positive zones – the indicator reached the boundary mark of 50 points. The vast majority of respondents – 91.2% of respondents - stated that the situation in the foreign exchange market had not changed during the reporting period. An equal number of survey participants chose negative and positive ratings. Last month, the share of negative ratings was higher than the share of positive responses by 3 percentage points.
The value of the Stock market Index component was 46.7 points (-2.1 points from the value obtained in March).
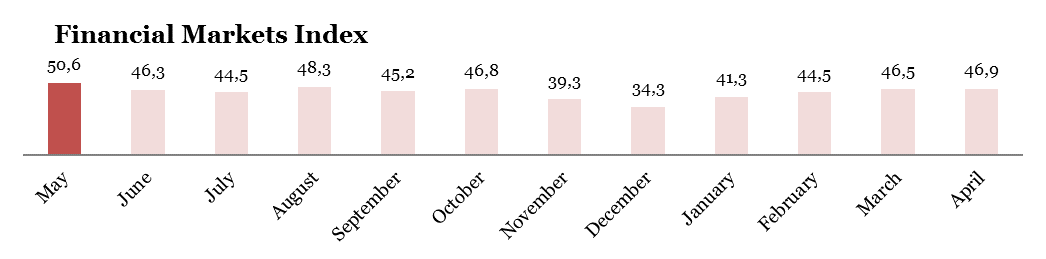
If in the last reporting period the Business Climate Index immediately rose by 8.2 points on the scale, then in April the pendulum swung in the opposite direction, and the Index value again decreased by 5.7 points to 42.4 points.
More than a quarter of the respondents are confident that the state of the business climate in the country has changed for the worse in a month. The share increased by 7.8 percentage points.
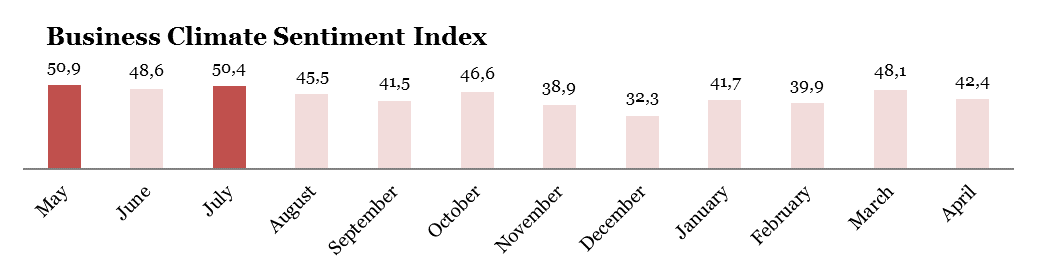
Social and Investment Activity Index in April 2025
Investment programs were implemented by 73.9% of companies in the reporting month.
79.7% of organizations employed employees. 2.9% of enterprises fired employees.
7.2% of companies used measures to reduce working hours to optimize costs.
89.9% of organizations implemented social programs for employees, and 58% of companies implemented programs aimed at supporting other categories of citizens.
If we talk about social programs for employees, they included:
- payment of additional funds to employees that are not provided for by the Labor Code of the Russian Federation (the share of the option is 71.4%);
- payment of vouchers for sanatorium treatment and children's holidays (65.1%);
- voluntary health insurance (63.5%);
- providing employees with food (60.3%);
- payment for transportation or delivery to work (57.1%);
- housing programs, including mortgages (34.9%);
- additional pension insurance (17.5%).
Some participants added their own answers to the question about social programs: they conducted programs to support and develop young employees; implemented corporate sports development programs, including organizing sports and cultural events; paid employees for gyms and fitness centers; provided maternity and childhood support, including support for large families; provided compensation to employees to pay for non-governmental preschool institutions; helped veterans and pensioners of enterprises; compensated for medical treatment; They provided additional vacation days; provided support to their employees and mobilized employees; gave gifts to employees' children on holidays and organized children's parties.
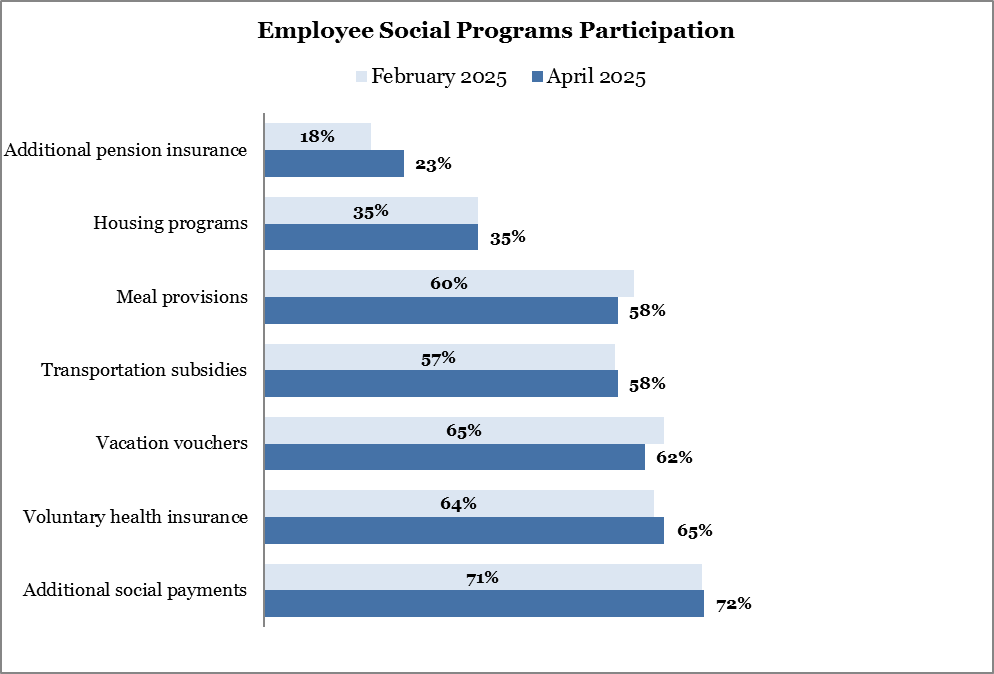
*100% represents the total number of companies that reported implementing social programs for employees. Companies could select multiple responses, so the sum of shares does not equal 100%.
In 77.3% of companies, the budget for social programs has not changed.
15.2% of respondents reported an increase in expenses, and 7.5% of enterprises surveyed had their budgets cut.
The Russian Union of Industrialists and Entrepreneurs (RSPP) conducted another round of surveys among industrialists and entrepreneurs in March 2025. The composite Index rose to 47,6 points, up 1,4 points from the previous month.
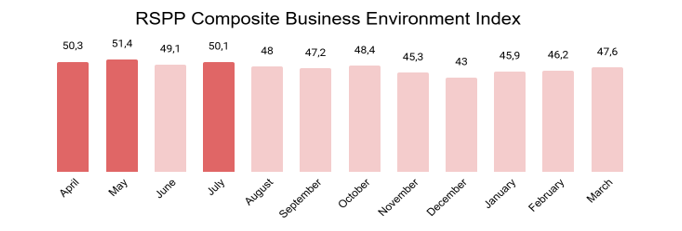
The Index for the market of manufactured products fell 1,6 points to 47,7. In particular, indicators for demand in the industry and for companies' own products/services, which had returned to the positive assessment zone last month, failed to sustain their position—their values equalized at 48,1 points. Accordingly, the assessment of demand in the industry decreased by 2,4 points, while the assessment of demand for companies' products or services dropped by 4,1 points.
The B2B Index showed negative dynamics, decreasing by 2,3 points to 45,7 points.
New orders showed little change: 65,4% of companies gave neutral responses, one-fifth of surveyed enterprises reported an increase in new orders, and 14,4% of companies saw a decline.
Companies faced greater difficulty in meeting their obligations to counterparties, compared to the previous month: this component of the Index stood at 46,4 points, down from February's 51,1 points. The indicator for "fulfillment of obligations by counterparties" also shifted negatively, dropping by 2,5 points to 38,5 points.
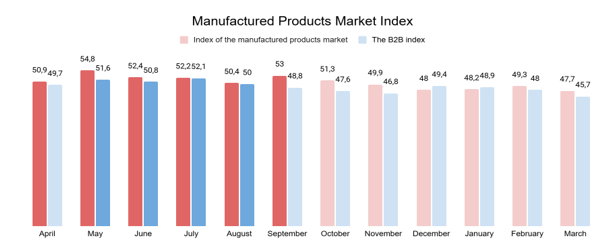
The Logistics Index reached 47,7 points, with a marginal monthly increase of 0,3 points.
Warehouse inventory levels held steady at 72,1% of organizations; one-fifth of enterprises reported an increase, while 8,7% saw a decrease.
The "average delivery time" indicator stood at 41,8 points (+0,5 points). 80,8% of respondents reported no change in delivery times for their companies. For 17,3% of organizations, delivery took longer than in the previous reporting period. Only 1,9% of enterprises managed to deliver products faster than a month ago.
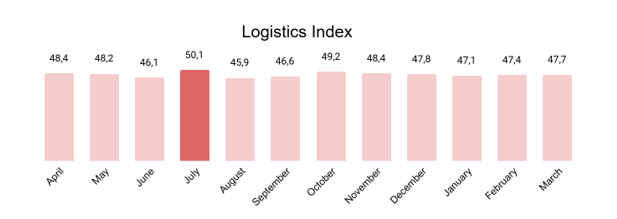
The B2G Index moved into the positive assessment zone with a value of 50,3 points, rising by 1,9 points on the scale.
This growth reflected improvements in two key indicators: the dynamics of business relationships with financial institutions and foreign partners.
The "business-government relations" indicator, in turn, maintained its value at 53,4 points.
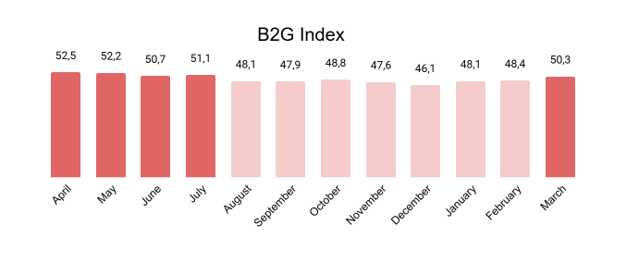
The Financial Markets Index stood at 46,5 points, up by 2 points compared to February's results.
The positive dynamics of the Index were attributed to growth in the indicators for "state of stock and currency markets." The former rose by 2,6 points to 48,8 points, while the latter increased by 3,2 points to 47,8 points.
The "financial position of companies" indicator remained unchanged at 42,8 points.
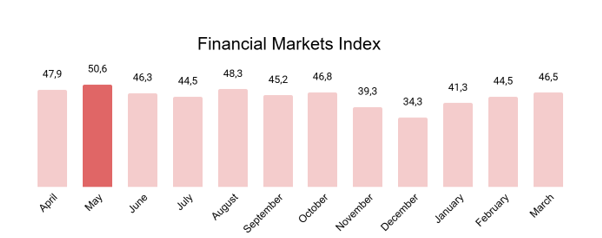
The Business Climate Sentiment Index jumped 8,2 points to 48,1
The share of positive assessments nearly doubled during the reporting period—from 7,6 p.p. to 14,4 p.p.
67,3% of survey participants held a neutral opinion about the state of the business climate in the country.
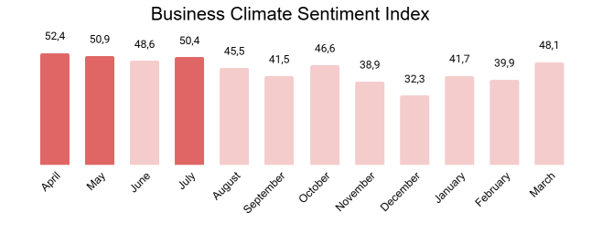
Social and Investment Activity Index in March 2025
As in the previous reporting period, more than two-thirds of surveyed enterprises were engaged in investment projects.
Among organizations investing in projects, 75,4% implemented their programs without any changes to schedules or budgets. The figure rose 9,3 percentage point, marking a significant change.
14,5% of enterprises fell behind on investment projects, while 2.9% completed them ahead of schedule., while 2,9% were ahead of schedule.
Additionally, 14,5% of companies had to reduce their investment volumes during the reporting period, while only 4,3% of enterprises managed to increase them.
88,5% of companies hired new employees. Only 2,9% of respondents reported layoffs in their organizations. Measures to reduce working hours for cost optimization were implemented by 6,7% of organizations.
88,5% of companies ran employee social programs, with the share increasing by 5 p.p.
Social support for other categories of citizens was provided by 52,9% of companies, a decline of 8 p.p., returning to the level recorded in January's survey round.
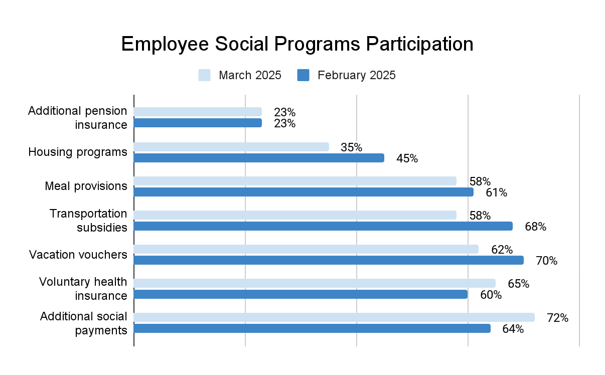
*100% represents the total number of companies that reported implementing social programs for employees. Companies could select multiple responses, so the sum of shares does not equal 100%.
In 71% of companies, the budget for social programs remained unchanged.
26,9% of respondents reported increased expenditures, while only 2,2% of surveyed enterprises reduced their budgets.
Approximately 70% of companies took steps to ease labor market pressures. Half of the organizations sent employees for internships and/or invested in advanced training for staff. 28,8% of companies organized temporary employment.
According to 45% of respondents, the business climate deteriorated in 2024. About 28% of the respondents believe that the situation remained unchanged while a similar proportion chose the response «the state of business climate has improved». Over the previous year the share of negative ratings has increased significantly – by 14 percentage points. At the same time companies have become less likely to provide positive responses.
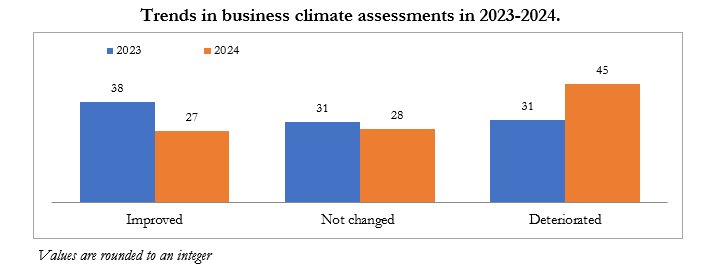
In 2024 companies’ performance was successful, according to 50,5% of respondents. A third selected «stable development» and 16,5% chose «challenging». Compared to 2023, respondents significantly more frequently selected positive evaluations, alongside a decline in the «stable» response category.
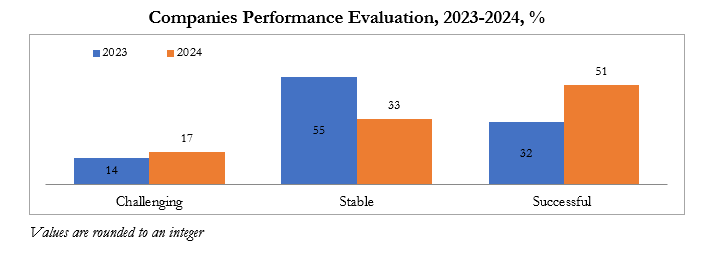
Russian companies maintained investment performance levels comparable to 2023. During the reporting period a majority of surveyed enterprises (51,9%) pursued large-scale investment projects. The volume of investments of a third of organizations was not so significant. These findings align with official statistics: fixed capital investments grew by 8.6% year-over-year in January-September 2024. However, about 15% of respondents indicated their companies did not implement investment programs in 2024.
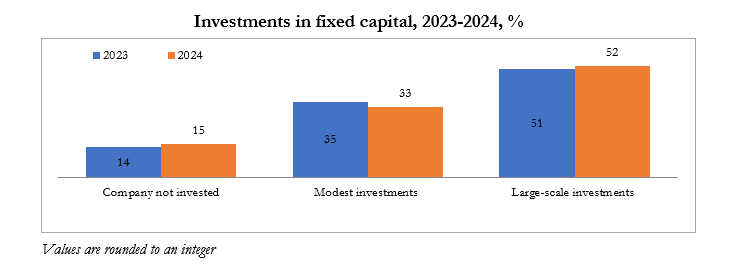
In general, most companies anticipate maintaining their 2023-2024 investments levels in 2025. 85,4% of firms have planned investment programs. Over 50% of surveyed enterprises intend to allocate substantial investment funds. The investment budget of a third of the organizations will not be so significant. About 15% of companies expect no investment activity in 2025.
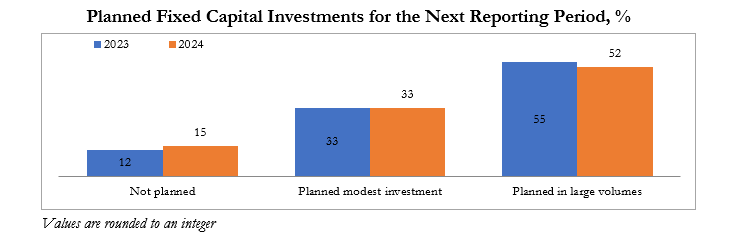
In the short-term, almost two third of the surveyed enterprises plan to invest in upgrading existing equipment. 41,2% of companies plan production facility retooling.
35,7% have allocated budgets for capital repairs of buildings and structures within a period of one to three years. The plans of 30.7% of companies involve the construction of new buildings and structures.
A quarter of companies want to invest in employee training and about under a fifth of the surveyed organizations (18,6%) intend to direct funds to digitalization projects.
13,6% are pursuing R&D work and innovation projects.
About a tenth of respondents are investing in the introduction of the best available technologies; in energy conservation, in programs to improve the energy efficiency of the enterprise; in intangible assets (patents, licenses, etc.).
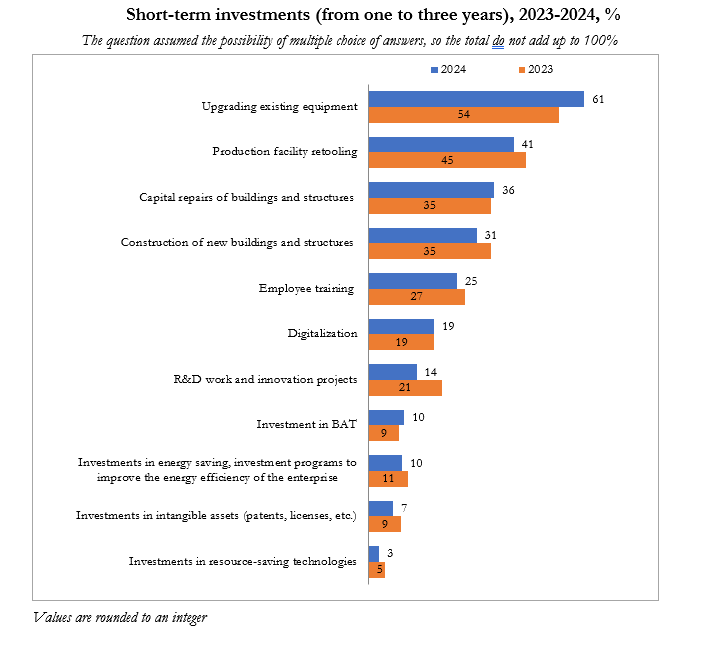
The most pressing issue for Russian businesses remains the shortage of qualified personnel, as reported by 70.1% of respondents.
The second major challenge, highlighted by 62.1%, is the high key interest rate. The relevance of this issue has surged over the past year — in the previous reporting period, it was mentioned significantly less frequently (44.2%).
Rising tariffs and increasing producer prices were cited by a similar number of survey participants, placing these problems in third place among the main obstacles for businesses in Russia.
The next two issues were excessively high taxes and the volatility of the ruble exchange rate. Respondents mentioned these significantly less often, with a combined share of 29.1%. The instability of the ruble exchange rate has become a slightly lesser concern compared to 2023, when this issue was noted by 45.9% of businesses.
A quarter of respondents identified difficulties in conducting foreign trade operations (logistics, settlements, insurance, etc.) as a key problem. In contrast to other issues, the relevance of this challenge has increased significantly — the share of this response rose by approximately 10 percentage points.
One-fifth of respondents believe that declining demand is limiting the operations of Russian companies. Slightly fewer businesses (17.5%) cited difficulties in accessing credit as a major obstacle.
13.6% of organizations listed excessive regulatory and supervisory pressure as a key challenge, while around 12% of respondents selected "unfair competition" and "high administrative barriers."
Approximately one in ten companies complained about an inefficient judicial system, difficulties in connecting to utility, transport, and other infrastructure networks, and underdeveloped infrastructure in general.
Somewhat less frequently (7.8%), businesses mentioned "excessively high fines for violations, including turnover-based penalties" and "insufficient protection of property and contractual rights."
The Most Critical Problems Hindering Business Activity
in Russia (2023–2024), %
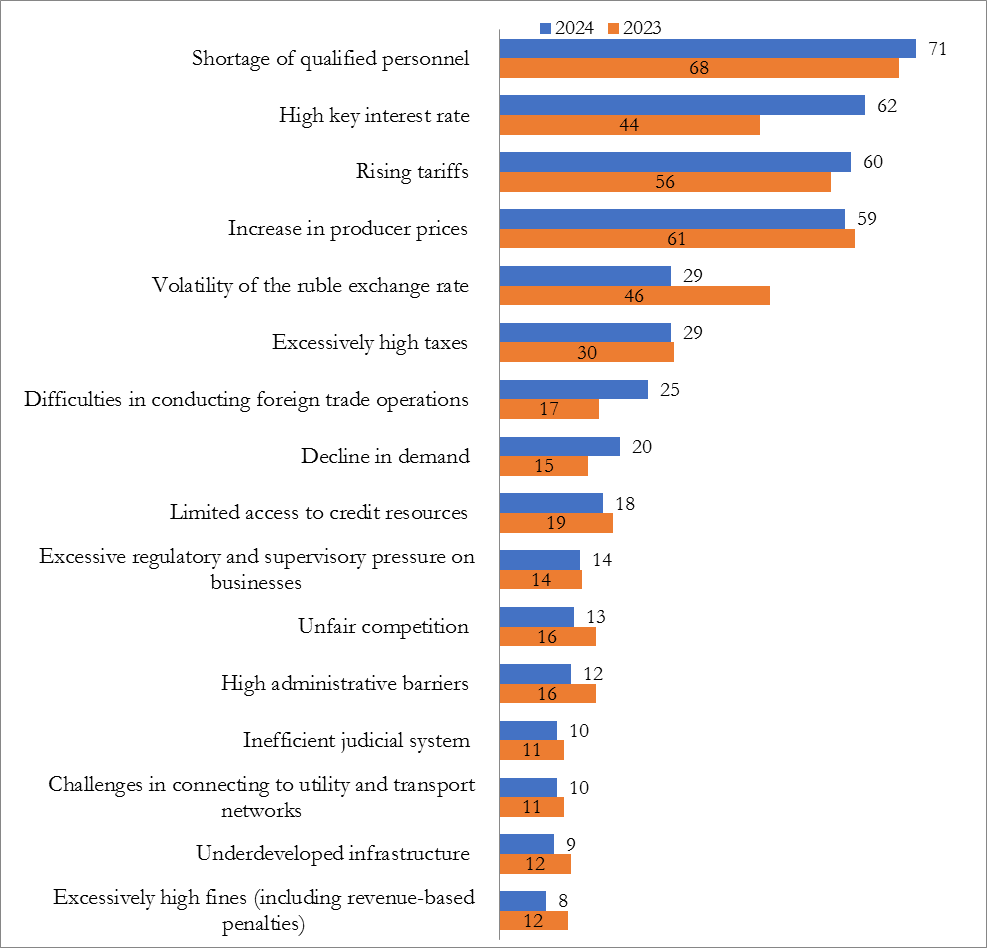
The survey allowed multiple responses, so the total does not sum to 100%.
Figures are rounded to whole numbers.
Only responses exceeding 10% in 2023 are included.
6.3% of surveyed enterprises cited poor-quality public administration as a problem, while 5.3% pointed to corruption in government bodies.
Fewer than 5% of respondents selected "risks of asset nationalization," "lack of clear national development goals," "inefficient tax administration," and "tightening environmental regulations."